
I run three blogs. Three separate Google Analytics dashboards. Three Search Console accounts. Three WordPress admin panels. And for a while, I was manually logging into all of them just to answer one simple question: how are my posts actually doing?
Spoiler: I wasn’t checking often enough. And when I did, I was squinting at numbers across nine browser tabs, trying to remember which post was losing traffic and which one needed an update.
So I did what any reasonable automation nerd would do. I built a system that does all of it for me. Here’s how I set up n8n workflows that automatically pull traffic data, keyword rankings, and post metadata from all three blogs into Airtable, plus a dashboard that ties it all together.
The Problem: Analytics Scattered Everywhere
If you run one blog, checking your numbers is manageable. Open GA4, glance at your top pages, check Search Console for keyword movement. Takes five minutes. Now multiply that by three.
Each blog has its own GA4 property, its own Search Console account, its own WordPress dashboard. The data lives in completely separate places, and none of them talk to each other. I wanted to know things like:
- Which posts across all my blogs got the most traffic this week?
- Are any posts going stale without me noticing?
- Which keywords are actually bringing in clicks?
- Do all my images have alt text? (Shocker: they didn’t.)
Answering those questions manually meant opening a minimum of nine tabs and doing a lot of mental math. So I stopped doing it, which is worse.
What I Built: The 10,000-Foot View
The system has three layers.
Airtable is the central hub. Each blog has its own base with tables for Posts, Performance, Keywords, and Content Health. Everything flows into these tables.
n8n is the automation engine. Six workflows run on schedules, pulling data from GA4, Google Search Console, and WordPress, then writing it all to Airtable.
A Cloudflare dashboard reads from all three Airtable bases and shows me a single view with tabs for each blog. Traffic charts, content health scores, keyword rankings, all in one place.
Weekly Traffic Sync: GA4 to Airtable
Three workflows (one per blog) run every Monday morning. Each one:
- Hits the Google Analytics Data API to pull the last 7 days of data
- Breaks it down by page title, with sessions, pageviews, and average time on page
- Categorizes traffic sources: Google, Pinterest, Direct, and everything else
- Writes it all to the Performance table in that blog’s Airtable base
The n8n Google Analytics node handles the OAuth and API calls. A Code node aggregates the raw data per page (since GA4 returns one row per page per channel), and the Airtable node creates the records.
I started with daily syncs, but honestly, these are newer blogs since I sold my old ones. Daily data was mostly zeros. Weekly gives me enough signal without cluttering the table.
What it looks like in Airtable: Each row is one post for one week, with columns for Sessions, Pageviews, Source – Google, Source – Pinterest, Source – Direct, Source – Other, and Avg Time on Page.
Monthly Keyword Tracking: GSC to Airtable
One workflow runs on the first of every month and pulls keyword data from Google Search Console for all three blogs in parallel. For each site, it:
- Calls the GSC Search Analytics API for the previous calendar month (actual first-to-last day, not a fixed 28-day window)
- Gets the top 100 keywords with their position, clicks, and impressions
- Writes them to the Keywords table in each blog’s Airtable base
This one uses HTTP Request nodes with a Google OAuth2 credential instead of a dedicated GSC node. The API is straightforward: POST to the searchAnalytics endpoint with your date range and dimensions.
Why monthly? Keyword positions fluctuate daily, and for newer blogs, weekly data is mostly noise. Monthly gives a clearer picture of trends.
What it looks like in Airtable: Each row is one keyword with Current Ranking Position, Clicks, Impressions, Ranking URL, and Date Checked. Over time, you can spot which keywords are climbing or dropping.
Weekly Posts Sync: WordPress to Airtable
This workflow runs Monday at 5am, before the GA4 sync at 6am, so the Posts table is always up to date when traffic data lands. It hits the WordPress REST API for each blog and pulls:
- Post title and URL
- Publish date and last modified date
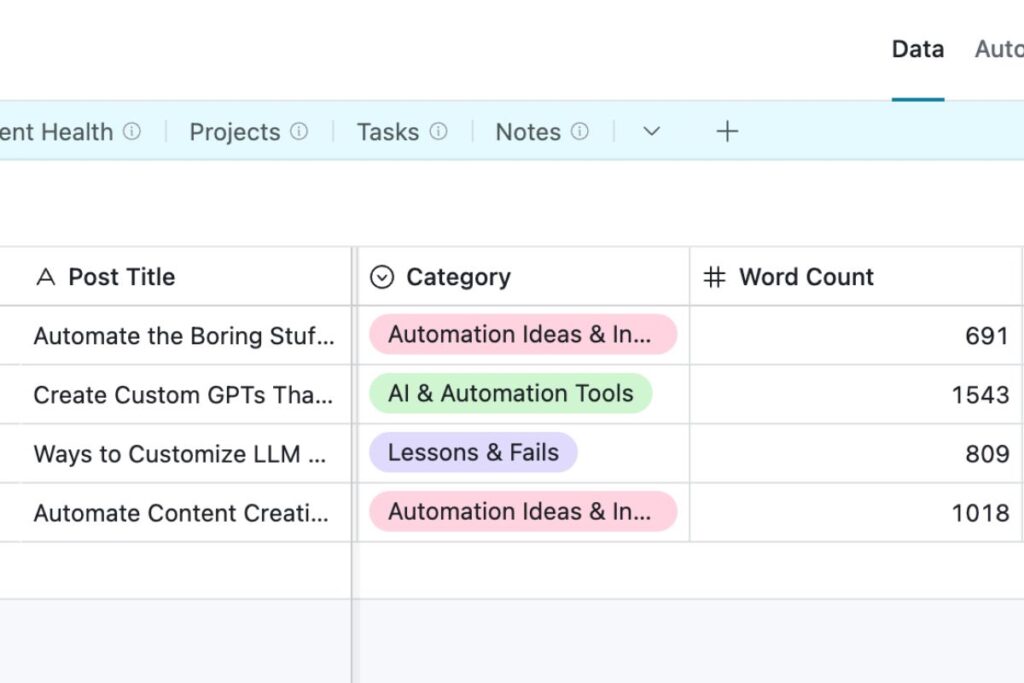
- Word count (calculated by stripping HTML from the content and counting words)
- Category (mapped from WordPress category IDs to names)
- Featured image status
- Internal link count (counted by searching the post content for links matching the blog’s domain)
The Airtable node uses upsert matched on URL, so it creates new posts and updates existing ones without duplicates.
Why this matters: The Posts table is the foundation that everything else connects to. Performance records, keyword data, and content health checks all link back to individual posts. Without this sync, I’d be manually entering every post into Airtable.
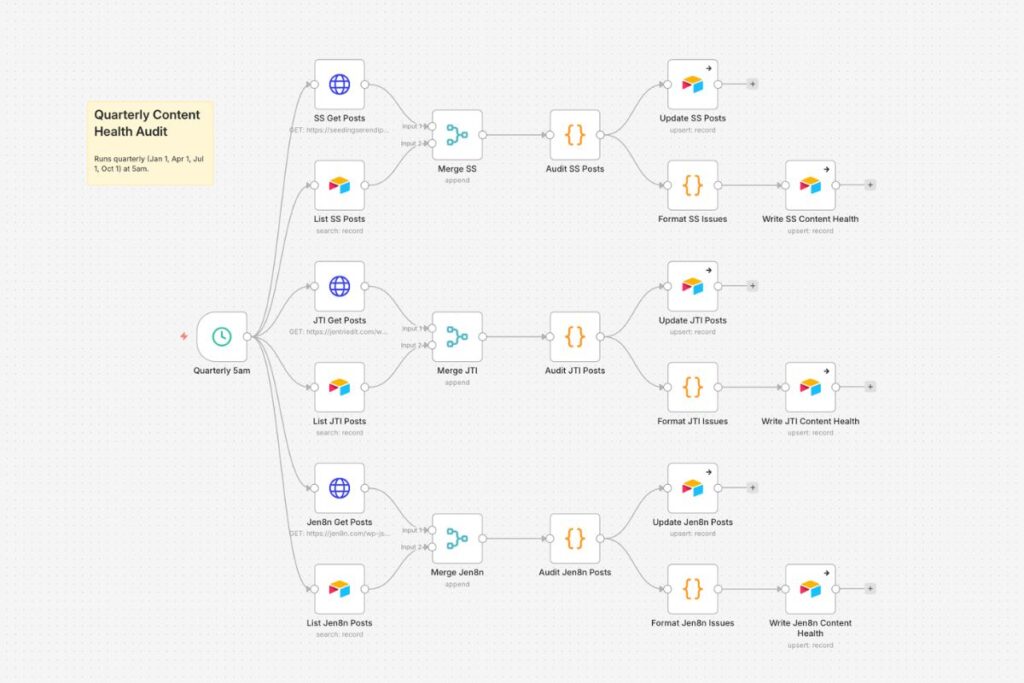
Quarterly Content Health Audit: 9 Automated Checks
This is my favorite workflow. It runs quarterly and examines every published post across all three blogs for common issues. It checks for:
- Missing alt text — finds every img tag without an alt attribute and lists the image filenames
- Missing featured image — flags posts where WordPress has no featured image set
- Thin content — posts under 300 words
- Stale content — posts not updated in 6+ months
- No internal links — posts with zero links to other content on the same blog
- No external links — posts with zero outbound links
- No subheadings — posts missing H2 or H3 tags (bad for readability and SEO)
- Short title — under 30 characters (weak for click-through rate)
- Long title — over 60 characters (gets truncated in search results)
Each failing check creates a record in the Content Health table with the check name, type (SEO, Quality, or Freshness), detailed notes about what’s wrong, and a link back to the post. The workflow uses upsert on the Content Health table, so the same issue just gets updated next quarter instead of creating duplicates. Once I fix an issue and mark it “Fixed” in Airtable, it won’t reappear unless the problem comes back.
What I learned running it the first time: Every single post on my newest blog had zero internal links. Makes sense, there were only three posts and I hadn’t linked between them yet. But I wouldn’t have noticed without the audit flagging it.
The Dashboard: One View for Everything
The workflows handle the data collection, but I still needed a way to see everything without opening Airtable. I built a single HTML dashboard hosted on Cloudflare Pages. It reads from all three Airtable bases through a worker proxy (so the API key stays server-side) and shows:
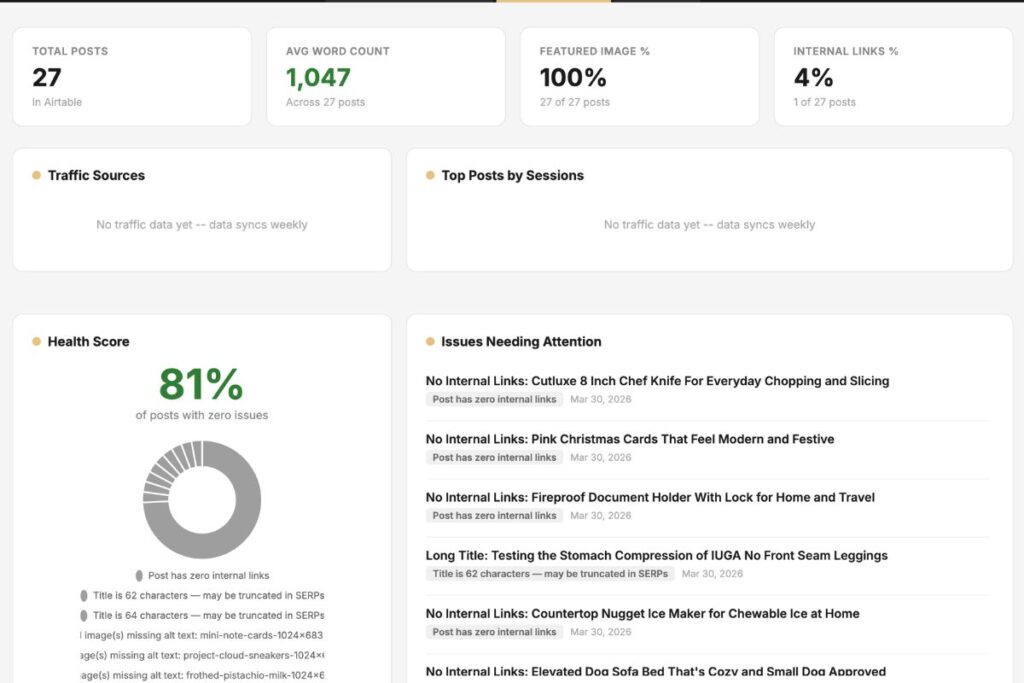
- Quick stats — total posts, average word count, percentage with featured images, percentage with internal links
- Traffic overview — a donut chart of traffic sources plus a top-posts-by-sessions table
- Content health score — what percentage of posts have zero issues, with a breakdown by type
- Issues list — every open content health issue with details, sorted by date
- Full content list — sortable table with every post showing word count, internal links, alt text status, primary keyword, and days since last update
- Keyword rankings — position, clicks, impressions, and CTR, all color-coded
Tabs at the top let me switch between blogs. Data is cached per tab, so switching back doesn’t re-fetch.
What I’d Do Differently
Start with the Posts table. I built the GA4 workflow first, but the Posts table is what everything links to. Sync your posts from WordPress first, then layer analytics on top.
Don’t over-schedule for new blogs. I initially set everything to daily. For blogs with under 20 posts, that’s just creating rows of zeros. Weekly (or even monthly) is plenty until traffic picks up.
Watch out for field defaults in n8n. The Airtable node in n8n caches your table schema, including dropdown options and checkbox defaults. If you include a field in the mapping but don’t assign it a value, it can write defaults that overwrite your real data. I accidentally zeroed out all my word counts this way. Only map the fields you’re actually writing to.
WordPress category IDs aren’t names. The REST API returns category IDs like [25], not names like “Mindset.” You either need the _embed parameter (which doesn’t play well with _fields) or a lookup table in your Code node. I went with hardcoded ID-to-name mappings, simple and fast.
Try Building Your Own
If you’re running even one blog, having your analytics piped into a central place is worth the setup time. You don’t need to build all six workflows at once. Start with the WordPress Posts Sync to get your content into Airtable, then add GA4 or GSC tracking when you’re ready.
The tools I used: n8n (self-hosted) for workflow automation, Airtable for the data hub, Cloudflare Pages for the dashboard, the Google Analytics Data API and Google Search Console API for traffic and keyword data, and the WordPress REST API for post metadata.
The whole system runs on autopilot. I check the dashboard when I feel like it, and every Monday morning there’s fresh data waiting. No more nine-tab analytics sessions.
I’ll be breaking down each workflow in detail in upcoming posts, and the content health audit is especially fun to build. I’ll also be sharing full workflow blueprints and templates as I go. Subscribe below so you don’t miss them.