

A print on demand sales tracker pulls the sales reports from every platform you sell on into one Airtable base, so you can see total royalties, which designs earn, and which ones have never sold. Mine covers Redbubble, Merch by Amazon and TeePublic. It turns scattered CSV exports into one table. Mine holds 385 designs and 379 sales since 2017, worth $958.91.

I have never had a niche and I am not going to pretend otherwise
Every print on demand guide starts with picking a niche. I have been uploading designs since August 2017 and I have never picked one. I make whatever I feel like making. A cassette tape joke one week, a pattern the next, something about spreadsheets after that, and then nothing at all for four months because I got interested in something else.
Print on demand is a small branch of what I do. It isn’t my income, it isn’t my focus, and I go through long stretches where I forget it exists. What I like about it is simple: once a design is done, it sits there, and sometimes it sells. I don’t have to keep feeding it. I upload the thing and get on with my life, and once in a while a couple of dollars shows up.
So the numbers are what they are. Since August 2017: 385 designs, 379 sales, $958.91 in royalties after refunds, an average of $2.53 a sale.
Then it gets more specific, and this is the part I couldn’t see before I built the tracker. Of those 385 designs, 180 have never been uploaded anywhere at all. They’re finished designs sitting in a table. Of the 205 that did make it onto a platform, 128 have never sold. And exactly 9 designs out of 385 are listed on all three platforms. 142 are on one and nowhere else.
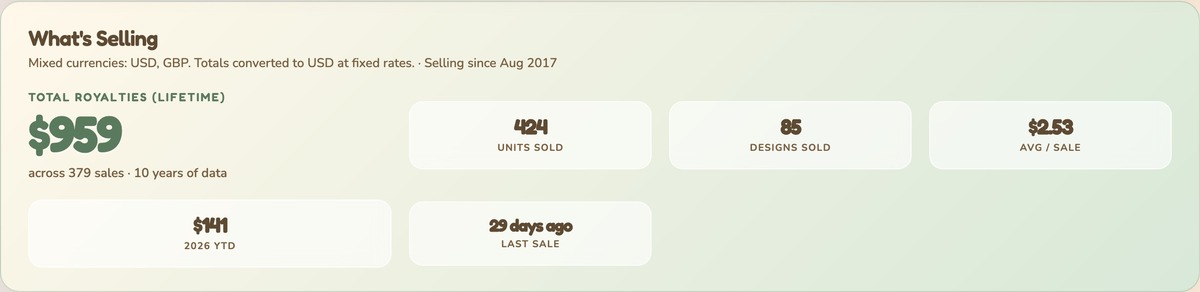
I know how those numbers read. I’m not going to dress them up. It’s throwing spaghetti at the wall, and a lot of the spaghetti never left the pot. But I couldn’t see any of this until I put it in one place, because the data lived in three separate platforms that don’t talk to each other and don’t even agree on what to call a sale.
What does a print on demand sales tracker do?
It takes the sales reports each platform gives you and merges them into one place so the numbers add up across all of them. Every platform shows you your own sales. None of them shows you your sales plus everyone else’s platform, which is the only view worth having when your designs are spread across three storefronts.
Mine has two halves. An importer takes a CSV export from any of the three platforms, works out which platform it came from, matches each row to a design, and writes it to Airtable. A dashboard reads that base and shows the totals, the pace by month and year, top earners, refunds, and the designs sitting at zero.
The importer is the hard half. Reading the data back out is straightforward once the data is in one shape. Getting it into one shape is where the actual work is.
Who is a print on demand sales tracker for?
Build one if you sell the same designs on more than one platform and you’ve stopped being able to answer basic questions about them. Which design earns the most across everything? How much have I made in total? Is this design even on TeePublic, or did I only ever upload it to Redbubble? If you’re opening three dashboards and doing mental arithmetic, a tracker is worth an afternoon.
Skip it if you sell on one platform only. One platform already gives you a report and a dashboard, and building a second version of a thing you already have is a hobby, not a solution. Skip it too if you have twenty designs. You can hold twenty designs in your head. The pain starts somewhere north of a hundred, when you genuinely cannot remember what you uploaded where.
It’s also worth saying this isn’t a growth tool. It won’t tell you what to design next and it won’t get you more sales. It tells you what already happened.
What do you need to build a print on demand sales tracker?
Four things, and two of them you already have if you’re selling.
- Your platform accounts. Redbubble, Merch by Amazon and TeePublic all let you export a sales report as a CSV. That export is the whole input.
- Airtable for the base. I pay for it. The free plan has a record cap you’ll hit eventually if you’re importing years of sales history, so budget for that rather than being surprised by it.
- A Cloudflare Worker to sit between the browser and Airtable. This one matters: the dashboard never holds the Airtable API key. It calls the Worker, and the Worker holds the key. Putting an API key in a page anyone can view source on is how you hand out write access to your own data.
- Claude Code to build it. I don’t hand-write these anymore. I describe what I want, it writes it, and I test it against real exports until it stops mangling things.
My base has three tables. Ideas for things I haven’t made yet, Designs for the 385 that exist, and Sales for the 379 rows of history. Sales link to Designs, which is what makes “this design has earned $179” a question the base can answer.
How does a print on demand sales tracker work?
You drop in a CSV and it does four jobs in order: work out which platform sent it, find the right columns, clean up the values, and match each sale to a design you already have.
Working out which platform sent the file
I don’t have a dropdown asking which platform this is. The importer reads the header row and guesses, because each platform leaves a fingerprint in its column names. A file with an ASIN column is Merch by Amazon, since nothing else uses ASINs. A file with “Artist Margin” is Redbubble. A file with “Design ID” or “Designer Earnings” is TeePublic. There’s a manual override for when the guess is wrong, but I rarely touch it.
Some of these exports also stick a paragraph of explanation above the actual header row, so the parser skips ahead until it finds real columns instead of choking on the preamble.
Finding the right columns
This is where the three platforms stop agreeing with each other. Same information, three sets of names:
| What it is | Redbubble calls it | Merch by Amazon calls it | TeePublic calls it |
|---|---|---|---|
| The design | Work | Title, Product Title | Title, Design |
| The money | Artist Margin, Your Earnings | Royalty, Royalties | Designer Earnings, Total Earnings |
| The date | Order Date | Earning Date, Earnings Date | Order Date |
| Date format | 20 Apr 25 | Dec 26, 2025 | Falls through to a generic parser |
| The identifier | Work ID | ASIN | Design ID |
So each platform gets its own column map, and each entry in the map is a list of candidate names rather than one name. Merch alone has eleven possible names for the date column, because the export has been renamed several times over the years and old files still need to import. The parser walks the list and takes the first one present in the file.
The date formats deserve their own note. Redbubble writes 20 Apr 25. Merch writes Dec 26, 2025. Those are different enough that a generic date parser gets the day and month backwards on one of them, so each format is matched explicitly and the native parser is only a last resort.
Cleaning up what the values mean
Product types were the fiddliest part, and the rule I ended up with is that order matters, most specific first. Nearly every apparel string also matches a looser rule, so a loose rule placed too early swallows everything.
Two real examples from my own code. TeePublic reports pillows as bare dimensions, so 18"x18" means pillow and nothing in the string says so. And kids sizing has to beat every apparel rule, because “Large, Youth (Ages 2-12), Navy” is a kids product first and a t-shirt second. Get the order wrong and every youth tee files itself as an adult tee.
Merch also splits by marketplace, so amazon.co.uk becomes Merch UK, amazon.de becomes Merch DE, and anything unrecognised falls back to Merch US. Which is how I ended up with a currency conversion layer for four sales. Out of 379 sales since 2017, 375 were in dollars and four were in pounds. I built exchange rate handling for four sales and I regret nothing, though I did use a fixed rate table rather than a live currency API, because these royalties are cents and a live rate would be a dependency doing no real work.
Matching a sale to a design
This is the part I got wrong first and had to rebuild. A sale row arrives with a title, and it needs to find the matching design out of 385. Titles never match exactly, because each platform mangles them differently on the way out.
It runs in passes. First it normalizes both sides: strip apostrophes so “don’t” and “dont” are the same word, turn punctuation into spaces, strip product suffixes off the end in any order, drop leading articles. Then an exact match on the normalized string. Then a second pass ignoring parenthetical bits, so “Artist Margin (USD)” still finds “Artist Margin”. Only if both fail does it fall back to a similarity score over the meaningful words, and anything below a floor score is treated as noise and creates a new design instead of guessing.
And then the rule I wrote into the code in capital letters, more or less: the similarity score only ranks suggestions for me to confirm. It never picks a design on its own. My catalogue is full of near-identical titles. Say I have “Sunday Slow Morning”, “Sunday Slow Morning Purple” and “Sunday Slow Morning Mug” as three separate designs. Any fuzzy matcher will confidently pick one of the three, and it’ll be right about two thirds of the time, which means one sale in three lands on the wrong design and silently corrupts the earnings table forever. A wrong match is worse than no match, so the machine ranks and I confirm.
There’s also an index that flags when one normalized title maps to more than one design, so I know to look closely before confirming.
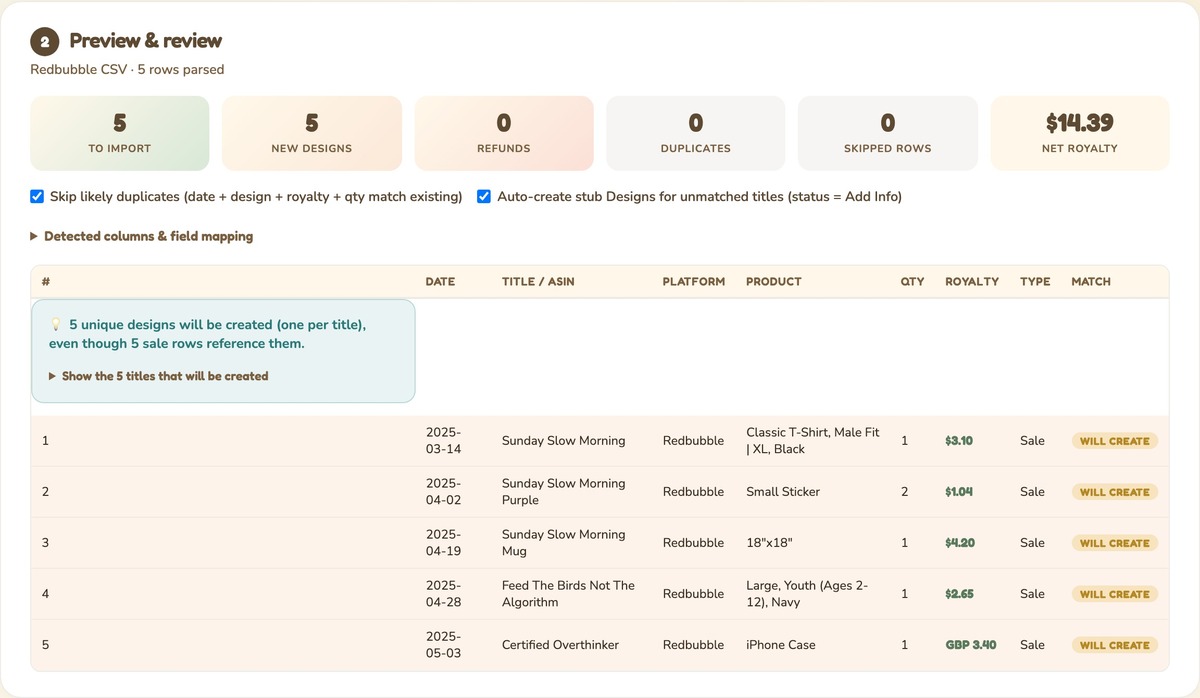
Rows that aren’t sales get skipped on the way in. TeePublic referral earnings have no title and no design ID, since they’re income but not tied to a design. Summary and total rows get dropped too, because importing a totals row would double count the entire file.
Get the generator
I’m not going to paste my own importer here, because it’s shaped around my base, my three platforms, and my own long history of weird title choices. None of that is yours.
Instead, the Sales Import Blueprint Generator below builds the plan for your setup. Tell it which platforms you sell on and paste in a header row from each of your own exports, and it gives you two things:
The import blueprint. Your canonical field list, a column map per platform built from your actual headers, the normalization and matching rules, and a prompt you can paste into Claude Code to build the importer.
The dashboard prompt. The read side, for once your base has data in it. Separate output with its own copy button, so grabbing one doesn’t mean scrolling past the other.
Change two things to make it yours: the platform list, and the product type rules, since your product mix won’t be my product mix. Everything else follows from your headers.
What it doesn’t do
Nothing syncs automatically. This is the honest headline. There’s no live API connection to any of the three platforms. I export a CSV at the first of the month, I run it through the importer, and the dashboard is accurate as of whenever I last did that. It’s a read layer over a base I feed by hand. I’ve thought about scheduling it and I haven’t, partly because the exports need a login and partly because checking print on demand numbers weekly would be a strange use of my attention given what they are.
It can’t tell me why anything sold. There’s no traffic source, no attribution, no link between a tag and a sale. 2025 was my best year at $309.03, and one design was $115.53 of it, which is 37 percent of the year from a single design. The dashboard shows me the spike. It has no idea what caused it, and neither do I.
Platform coverage is checkboxes only. I can see a design isn’t on TeePublic. I can’t see how long it’s been missing, because there’s no upload date per platform, only a ticked or unticked box. So there’s no velocity view and no way to tell a two week gap from a two year one.
Spoonflower is tracked in the base but left off the dashboard. I sell so little there that a fourth column made every chart worse. The data is still in Airtable if I want it later.
Frequently asked questions
How much does it cost to build a print on demand sales tracker?
The build itself is free if you already have the accounts. Airtable is the running cost, and the free plan works until your Sales table gets big, at which point you’re on a paid plan. A Cloudflare Worker to hold your API key sits inside the free tier at this volume.
Do I need to know how to code?
No, but you need to be willing to test. I describe what I want to Claude Code and it writes it. The part you can’t skip is running your own real exports through it and checking the output, because every platform export has quirks and the only way to find them is to hit one.
Can I use this with Etsy or Society6 instead?
Yes. Nothing about the approach is specific to my three platforms. If a platform gives you a CSV export with a date, a title and an earnings column, it can have a column map like the others. That’s the whole reason the generator asks for your headers instead of assuming mine.
Why not connect directly to the platform APIs?
Most print on demand platforms either don’t offer a sales API to sellers or gate it behind an approval process. CSV export is the one thing all three reliably give you, so building on the export means the importer works everywhere rather than on whichever platform approved me.
How long does it take to import a year of sales?
A single CSV takes under a minute once the parser knows the format. The slow part is the first run on a new platform, where you’re confirming fuzzy matches by hand. After that the design links already exist and repeat imports are quick.
Try it yourself
If your designs are spread across more than one print on demand platform, the fastest useful thing you can build is an importer that merges the exports into one table, plus a dashboard that reads it. Start with the column map, because everything downstream depends on the platforms agreeing on what a sale looks like. Use the generator above to get the blueprint for your own platforms, then build it and run a real export through it.
A tool I built
Energy Battery
Log your energy through the day and watch your battery fill, so you can see what actually charges you and what drains you.
Find your spark →I run an affiliate program on the tools I build. Approved affiliates earn 20% on what their referrals pay, for up to a year. US only for now. See the program →
Related reading
- Build a Reselling Profit Dashboard With Airtable
- Build Your Own Reading Tracker With Airtable and n8n
- What Is a Claude Code Skill?
Subscribe if you haven’t already. I’m working through the rest of the tools I built for myself and writing up how each one works, mess and all.